Indicator
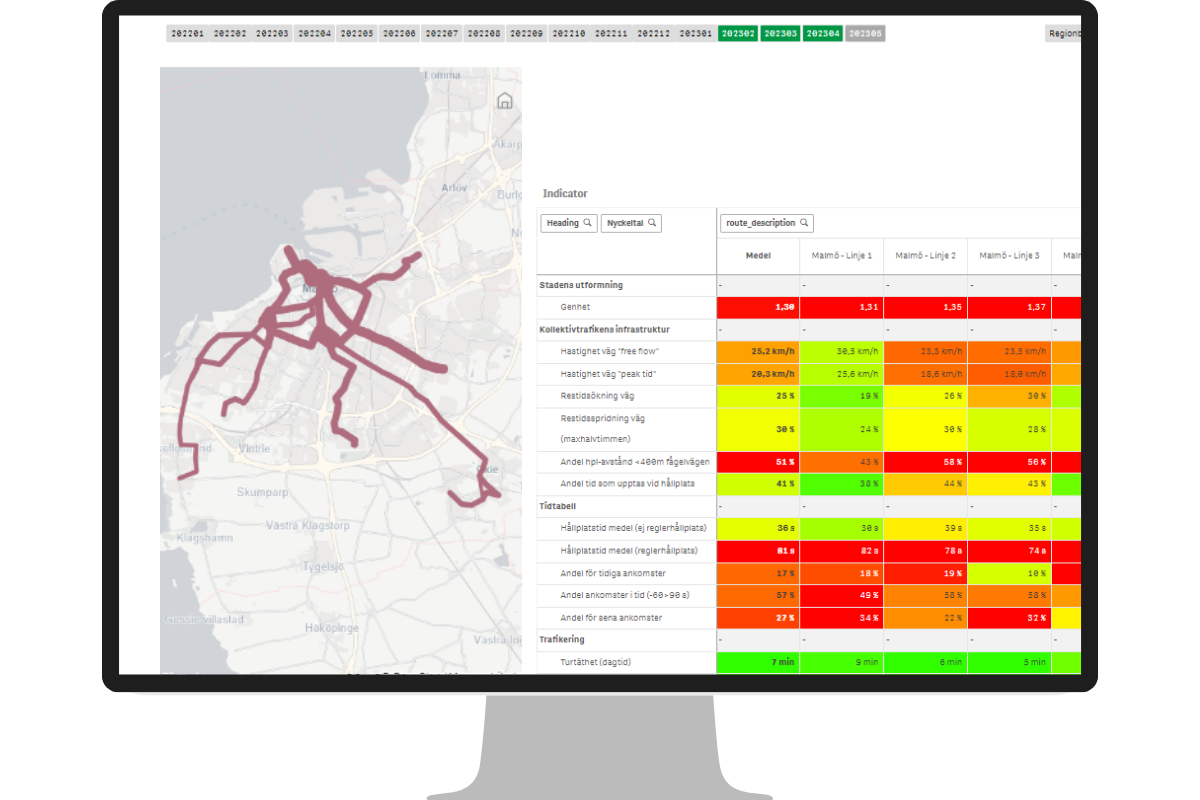
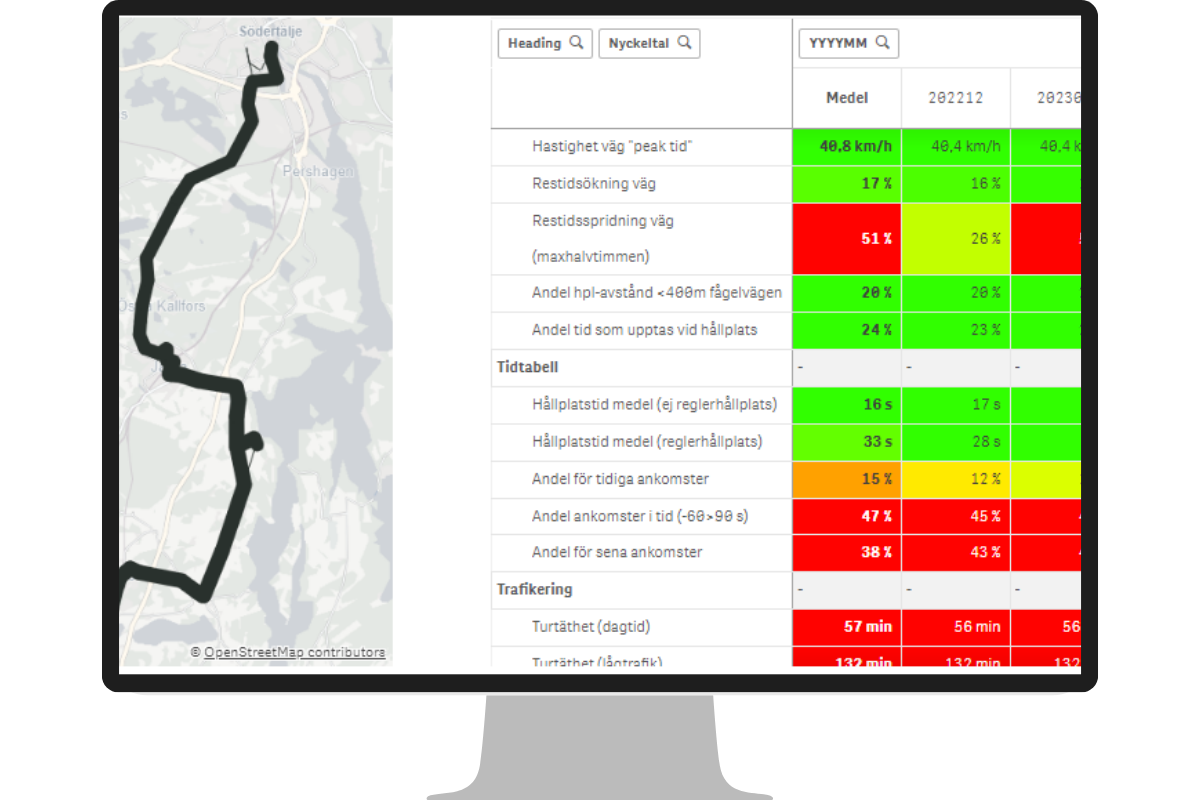
How do you measure the success, efficiency and attractiveness of public transport? Indicator provides you with key performance indicators that give you a quick overview so you can easily monitor the performance and development of your routes.
The Swedish Association of Local Authorities and Regions has found it difficult to find accurate comparative figures. Therefore, together with traffic and accessibility experts, we have produced the key figure report in Flowmapper that can form the basis for such a comparison.
Indicator revolutionizes the monitoring and analysis of public transport. Indicator has the potential to become the industry standard for making public transport measurable, sustainable and more attractive to travelers.

With Indicator, you can continuously monitor public transport routes to see how they perform based on Flowmapper's quality-assured data
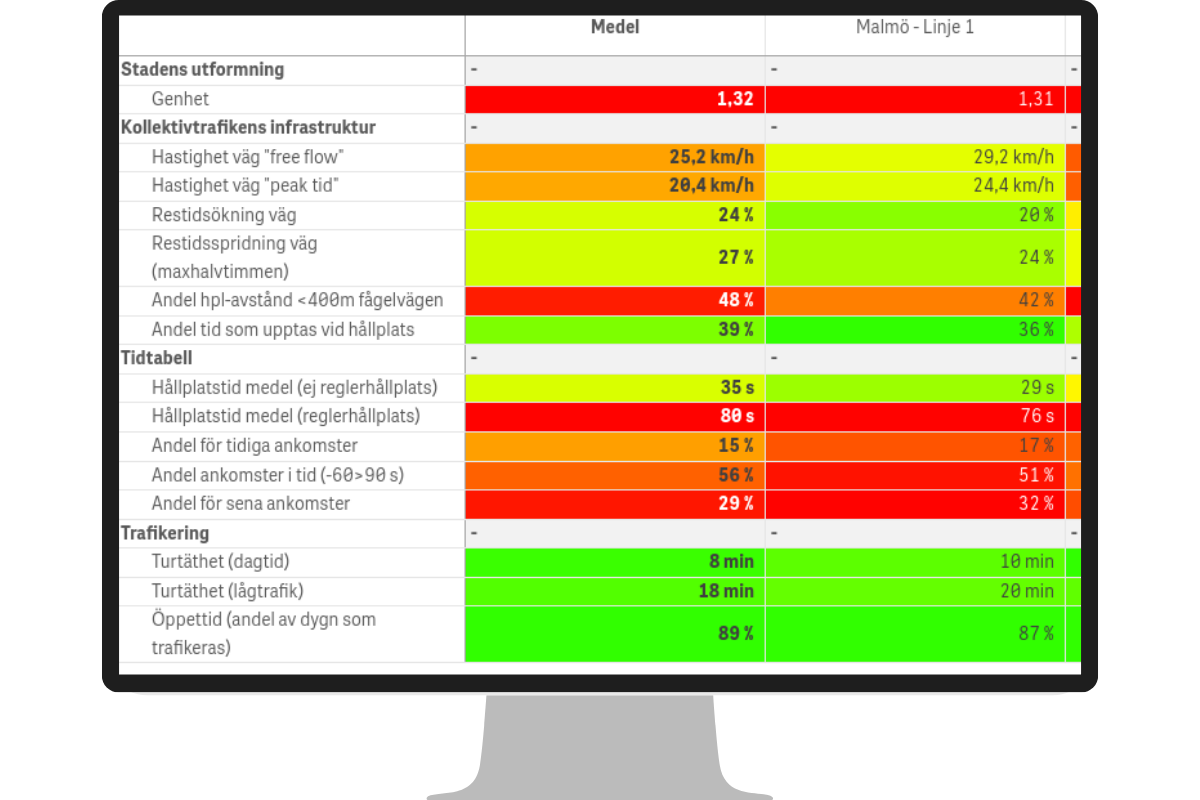
The indicator includes 14 different key performance indicators that describe the attractiveness of public transport from the outside:
-
Urban design
-
Public transport infrastructure
-
Timetable
-
Traffic management
Indicator enables all public transport operators to relate to common metrics and compare their results with other cities and operators, to ensure attractiveness and competitiveness. Continuous monitoring of implemented measures over time allows the effect to be evaluated and new needs to be identified.
"Key performance indicators report in 11 sec from 70 billion data points"
Eva-Marie Wenehed, Tyréns
You get a status report on how the lines are performing
Regularly monitoring the development of different routes makes it easier to plan efficient and attractive public transport. Together, the key figures provide a comprehensive picture that gives you answers to questions such as:
-
Is the route alignment suitable for the bus?
-
Can the bus get there quickly?
-
Does the bus arrive when passengers want to go?

Public transport that benefits the whole community
It has never been easier to identify where time and money can be saved and benefit the most travelers. Indicator does not only show you the accessibility and punctuality of routes, but also map out stop spacing, frequency, and accuracy.
Monitor the impact of measures
Public transport in Sweden generates an annual turnover exceeding 40 billion SEK. Delays on a typical city bus route in a medium-sized city can incur traffic costs of up to one million SEK per year. Follow-up provides valuable experiential feedback, yet it is often deprioritized when time is limited. With Indicator's automatically generated key figures, you receive a quick and intuitive overview that can be shared with employees, politicians, and travelers, for instance, in public transport reports.

Compare your routes to other routes or businesses
The KPI reports enable you to evaluate outcomes across various bus routes or benchmark against other municipalities, transport authorities, and operators. The indicator establishes a unified baseline for relevant metrics, and the results are measured against a national standard.
Nyfiken? Fyll i formuläret
Så kontaktar vi dig och hjälper dig igång med datadriven kollektivtrafikplanering som gör skillnad.


.png)

