*50 billion in March 2024, increasing by approximately 2 billion data points per month.

No more guessing games and poor decision-making


In just moments, you can access billions of optimized and quality-assured data points from real driving times through an intuitive and visual interface. Additionally, the driving data increases by 2 billion every month, all year round. Flowmapper thus offers you entirely new opportunities to visualize, analyze, and optimize public transport.

The entire bus system is displayed on a map with color-coded statuses, allowing you to quickly identify the biggest challenges in your specific public transport network. Increase the level of detail by zooming in to see every line, every bus on every curve, and every bus stop. The distance between data points is just 25 meters.

Utilizing all this driving data, you can automatically generate timetables that eliminate unnecessary waiting times and enhance punctuality through AI.


Dator Analytics skärm

"THE TOOL IS A GAME CHANGER"

Niclas Andersson, Uppsala Municipality

Flowmapper - data-driven public transport planning

Flowmapper is a web app, a SaaS solution that makes it available to everyone, everywhere, at any time! Follow the links below to learn more about Flowmapper and understand why so many are excited about the possibilities of data-driven public transport planning.

Macro planerade turer
Indicator
Data 1080x1080 - Flowmapper

Analytics

Visualize billions of data points on the map. By combining illustrative maps with informative graphs, you can analyze with unique accuracy. Filter, deep dive, or zoom out and experience the power of a data-driven approach.

Indicator

How much effect did the measure have? Is the route alignment good? Is it quick for the bus to arrive? Does the bus arrive when passengers want to go? These and many more questions will be answered when you use the Indicator.

Public transport data

Using data as a basis for optimizing public transport places very high demands on its quality. That is why we have developed a unique process that ensures world-class quality.

Municipalities

Develop effective infrastructure using enhanced insights from data displayed on maps, graphs, and charts.

  • Optimize infrastructure planning
  • Predict traffic issues
  • Encourage sustainable practices
  • Enhance resource utilization efficiency
  • Base decisions on data analysis

Public transport authorities

Leveraging Flowmapper to design efficient and sustainable bus services.

  • Improved insights into traffic optimization
  • Pinpoint inefficiencies
  • Maximize resource utilization

"The choice of accessibility measures becomes clearer and easier to justify"

Hanna Larsson, Skånetrafiken

Bus operators

Enhance public transportation by creating AI-driven timetables derived from real journey data.

  • Create automatic timetables
  • Evaluation of travel time gains
  • Streamline the bus fleet
  • Significantly better decision-making


Traffic consultants

Evaluates public transportation and recommends precise interventions validated by driving data.

  • Efficient approach and quick insights
  • Accessibility studies with well-founded proposals for interventions
  • Detailed design based on actual needs
  • Analysis of the public transport system


Say goodbye to poor punctuality with Flowmapper!


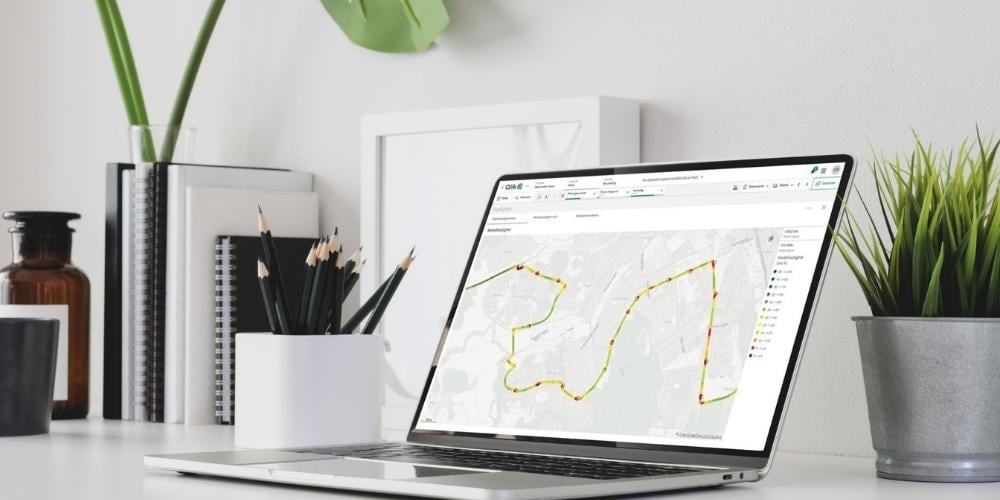
Flowmapper helps you communicate and coordinate public transport and work in a data-driven way. It provides a better basis for decision-making and allows you to monitor and improve public transport based on relevant KPI reports. You can even compare bus routes against each other and see the speed, punctuality, stop spacing, frequency and accuracy of the routes.

However, many people find that the most powerful part is that you get insights into where investments make the most sense, saving large amounts of taxpayers' money.

When it comes to in-depth knowledge regarding the performance of the public transport system, Flowmapper is the market leader due to our unique backend and enormous database.


Public transport authorities

Using Flowmapper to create efficient and sustainable bus services.

  • A Swedish innovation from Tyréns
  • Swedish traffic experts support you
  • Optimized and unique data
  • Data points every 25 m along the entire
    line
  • Simple interface and easy to get started
  • Historical data gives you a time machine
  • Follow up traffic improvements  with data

We specialize in using data to plan public transport effectively.

Need assistance with our products and services? From initial inquiry to final implementation, we support you in optimizing public transport.