Analytics
Where are the bottlenecks in the system and what are their causes? Does the timetable need to be adjusted to create a more attractive route? What measures would create the maximum benefit for our tax money? And what were the effects of measures implemented in the past?
With a few clicks, you can get answers to these and many other questions thanks to Flowmapper Analytics. With unbeatable precision and detail, it visualizes how public transport flows throughout the system or along a line all the way down to each individual departure.
You quickly get an overview and in-depth understanding of e.g. accessibility, punctuality, speed, stop time, and passage time. Thanks to +70 billion data points showing actual travel time, you also get answers to which measures have had the desired effect on public transport.
-
Visualize public transport with very high precision
-
Identify accessibility gaps in detail
-
Quantify the costs of these gaps
-
Forecast the impact of planned measures
-
Follow the evolution of public transport over time
-
Check speed compliance
-
Establish timetables according to tactical driving times
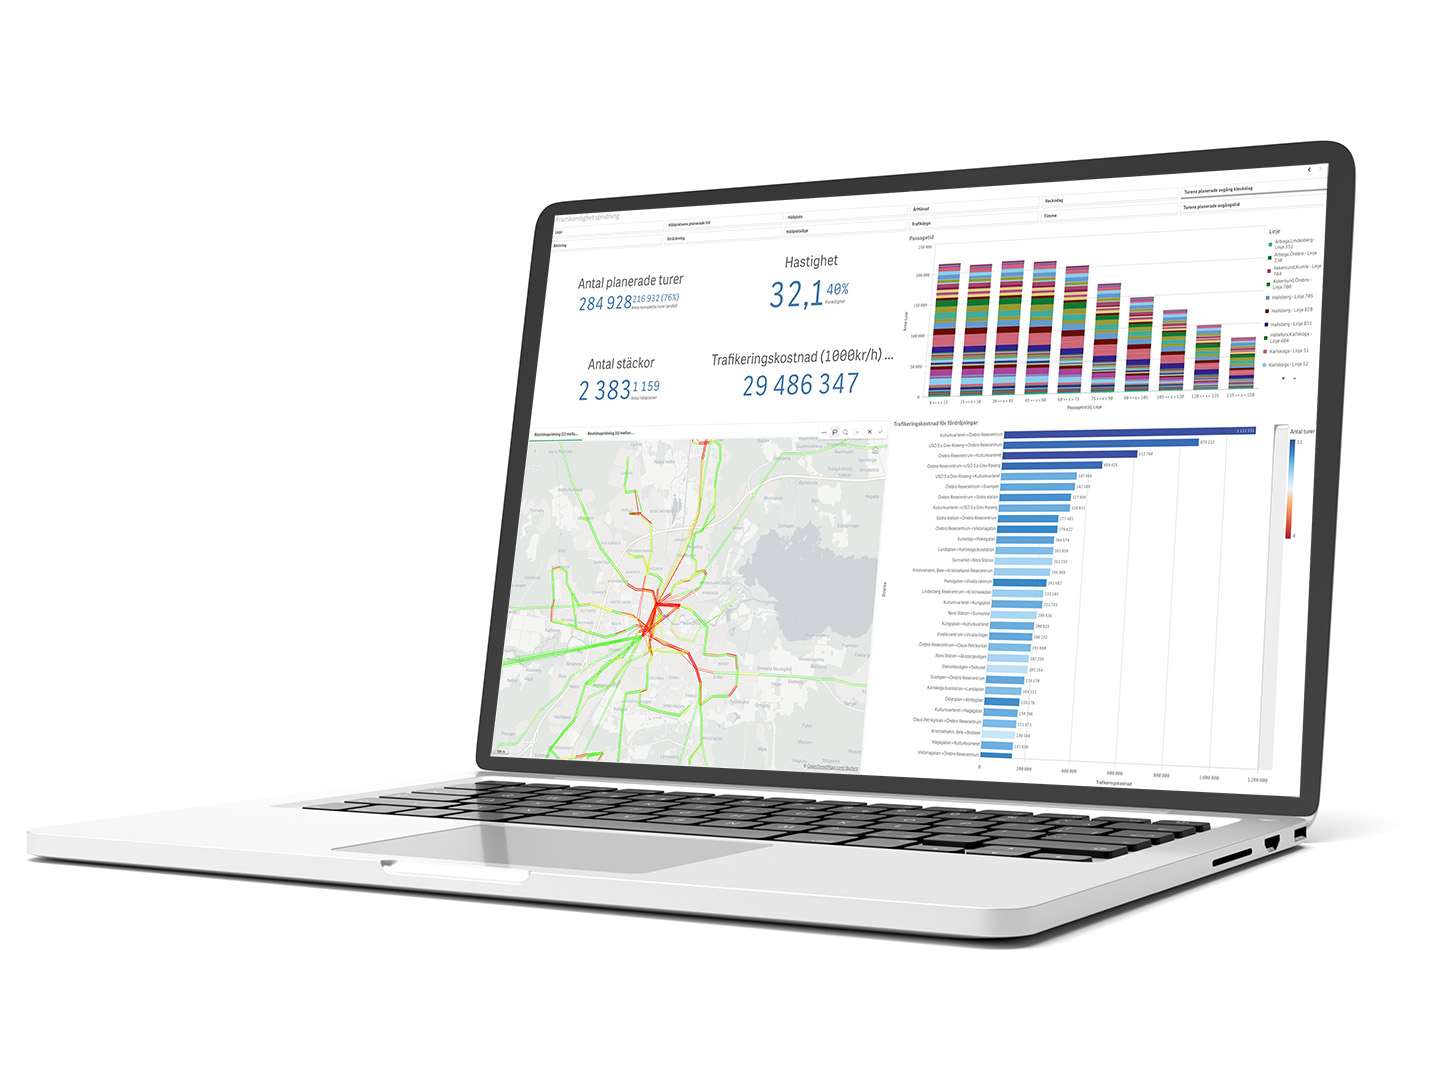
Flowmapper Analytics gives you different perspectives on public transport, Macro for the system perspective over a whole city, municipality, or region, and Micro - route perspective down to 25 meters distance. Below they are described and how you can benefit from the power of data-driven public transport planning!

Macro for the overall system perspective
With the System Perspective Macro in Flowmapper Analytics, you get an instant overview of the health of public transportation in your area, whether it's a city, municipality, or region. At a glance, you identify critical bottlenecks, perceive punctuality, and review where costs are going due to inefficiencies in the bus system. This overview helps you prioritize actions and effectively allocate resources where they are needed most.
-
See the status of public transport across the system
-
Detect critical bottlenecks in seconds
-
Quantify the financial impact of delays
-
Instant overview of punctuality for the whole public bus transport system
-
Identify slow routes and areas with low public transport supply
-
Understand where and when resources can be better allocated.
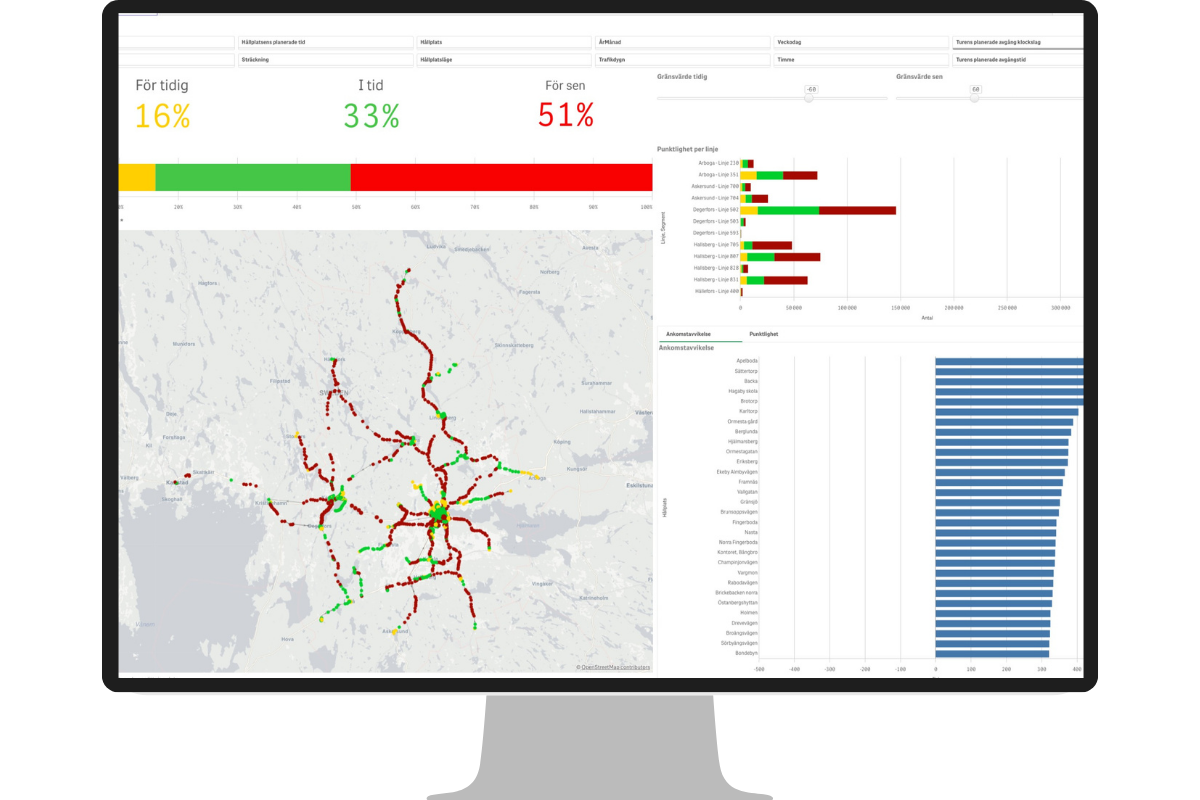
In seconds, you can see the punctuality of all stops throughout the system. Here, 16% of all buses are early, 33% are on time and 51% are late.
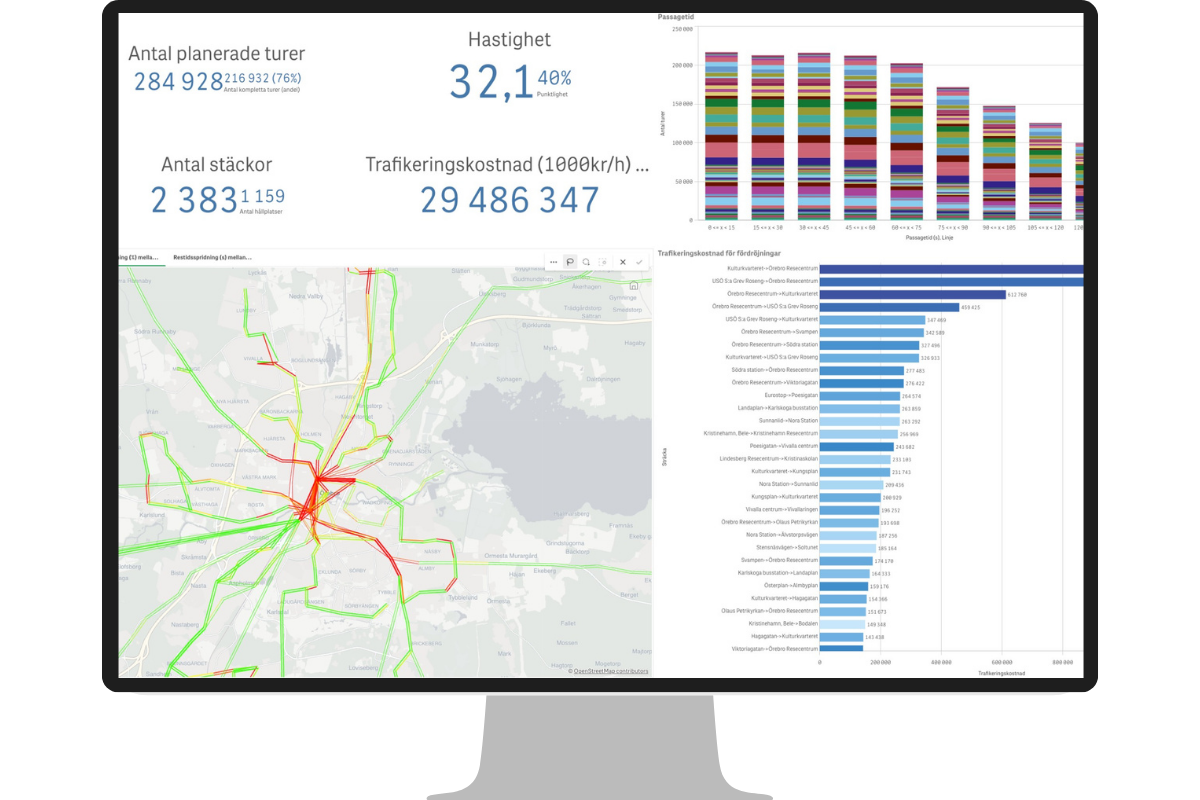
Identify the main accessibility deficiencies in the system and quantify the traffic costs of the delays.

Can you clearly see which roads are the slowest for public transport and where the bottlenecks are?

Get a quick overview of the lines and routes with the greatest public transport offer but also areas that lack satisfactory access to public transport
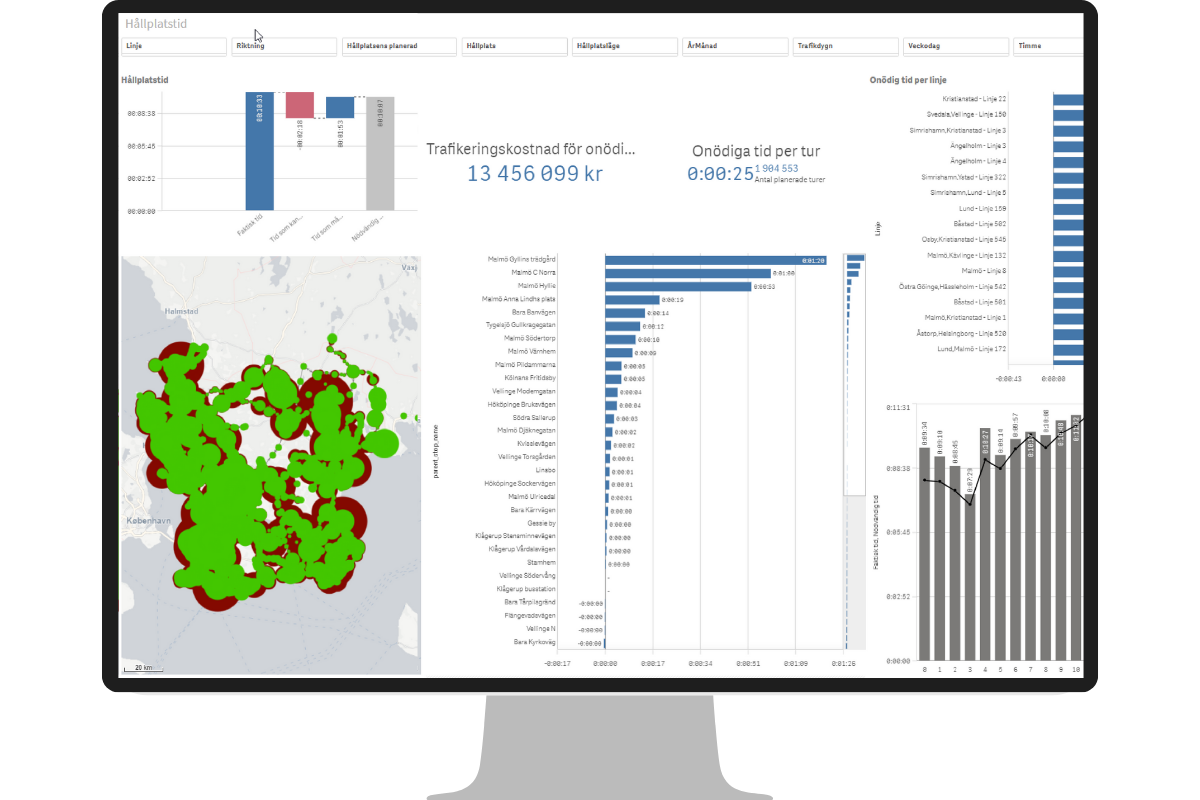
Stop time
Analyze all trips' stop time and you will quickly see how much is unnecessary stop time and what costs these entail.
Micro for the route perspective
Dive into the details with the Route perspective Micro in Flowmapper Analytics. Equipped with extremely detailed and quality-assured data, you are given the ability to review a line at 25-meter intervals, every stop along the way and every single departure. This level of detail enhances your decision-making, ensures the right actions in the right place and enables effective communication with all parties involved.
-
Extreme level of detail for each line and stop
-
Analysis at 25 meter intervals for precise insights
-
Visualize speed variations with color coding
-
Increase understanding of travel times and potential bottlenecks
-
Follow up and optimize punctuality
-
Match timetable with actual driving time and optimize
-
Spot and correct inefficient column driving
-
See the whole picture, from peak to off-peak, to identify variations and opportunities
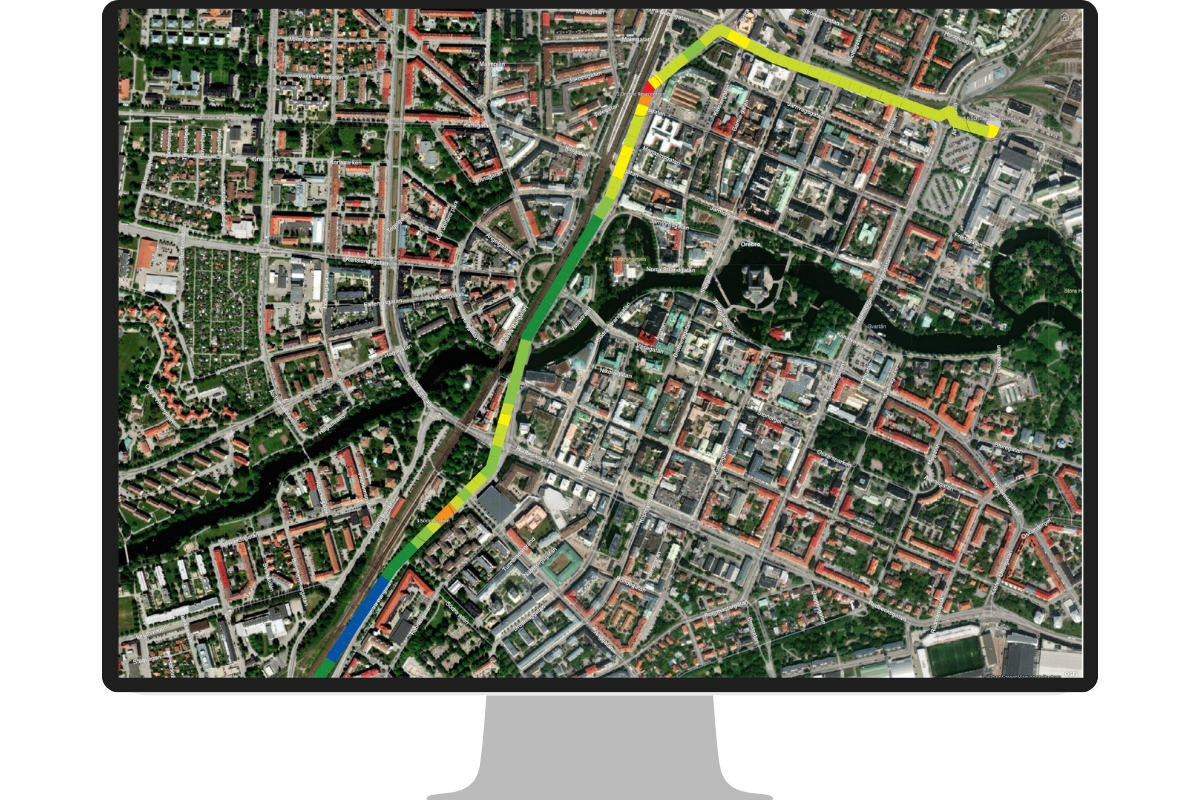
Map views
You can choose different looks and freely filter the data displayed in the views. Zoom out and see the whole line or why not zoom in on a stop with a specific departure?
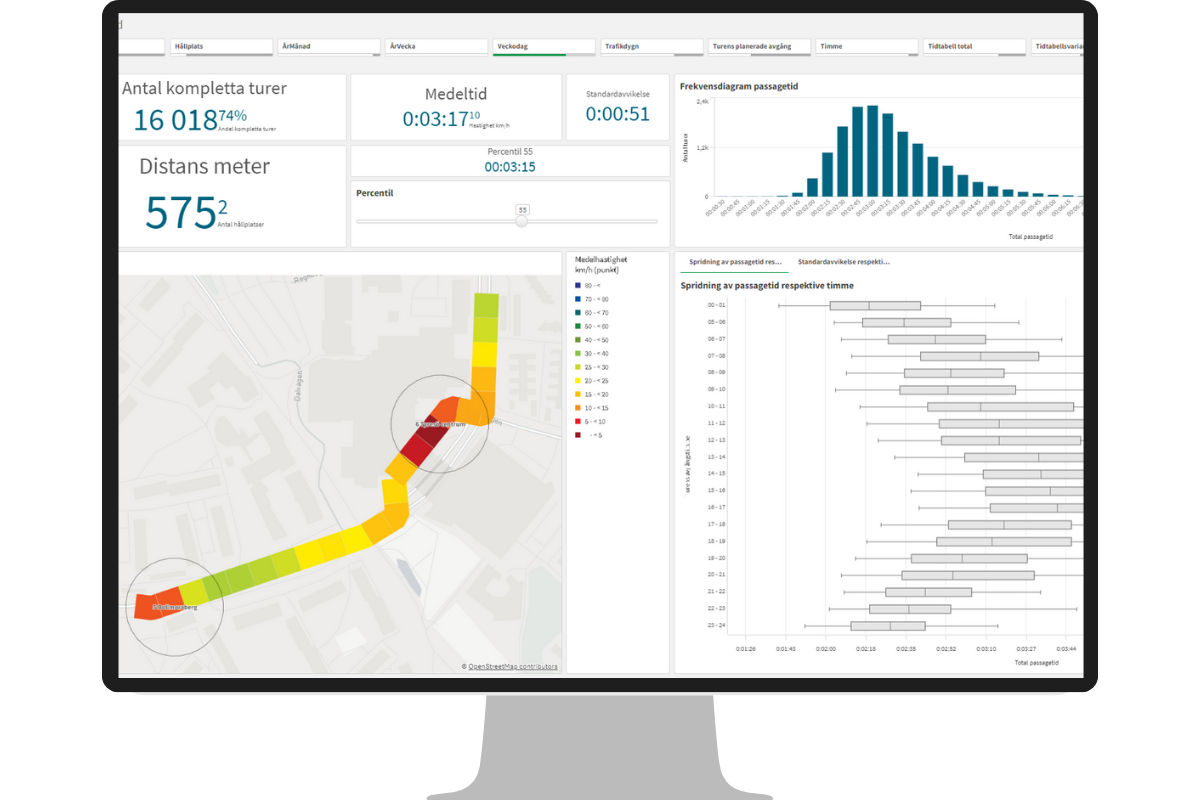
25 meter close up
With a very high level of detail, you can perform precise and accurate analysis. Every curve, every stop, every speed bump. With Flowmapper Analytics you see all the details.

Color-coded speed
The line is color-coded by speed, which makes it easy to understand where the bottlenecks might be. Is the bus going too fast past the school because of a previous delay?

Passage time
Identify accessibility problems by studying how much longer it takes to drive in peak hours compared to off-peak hours.

Punctuality
Does the timetable need to be redistributed? With Flowmapper Analytics, you get the answer to what percentage of buses are early, on time or late at each stop.

Optimal travel time
Comparing the actual driving time with the timetable makes it even clearer if the timetable needs to be adjusted. How much work would it take to do that without Flowmapper?

Inefficient timetables
High frequency is a good thing, but when buses run in a column, i.e. too close to the next service, it is a waste of resources. This is a completely new way of illustrating the problem.
Vi hjälper er igång!
Flowmappers expert team står alltid redo att guida dig från första fundering till optimerad kollektivtrafik. Vi erbjuder inte bara Flowmapper – vi erbjuder även skräddarsydda tjänster för att analysera era specifika busslinjer, resvägar och trafikflöden. Allt för att säkerställa en smidig övergång till en mer effektiv och datadriven kollektivtrafikplanering.
Klicka på knappen ovan för att komma till kontaktuppgifterna till våra kollegor.


.png)


